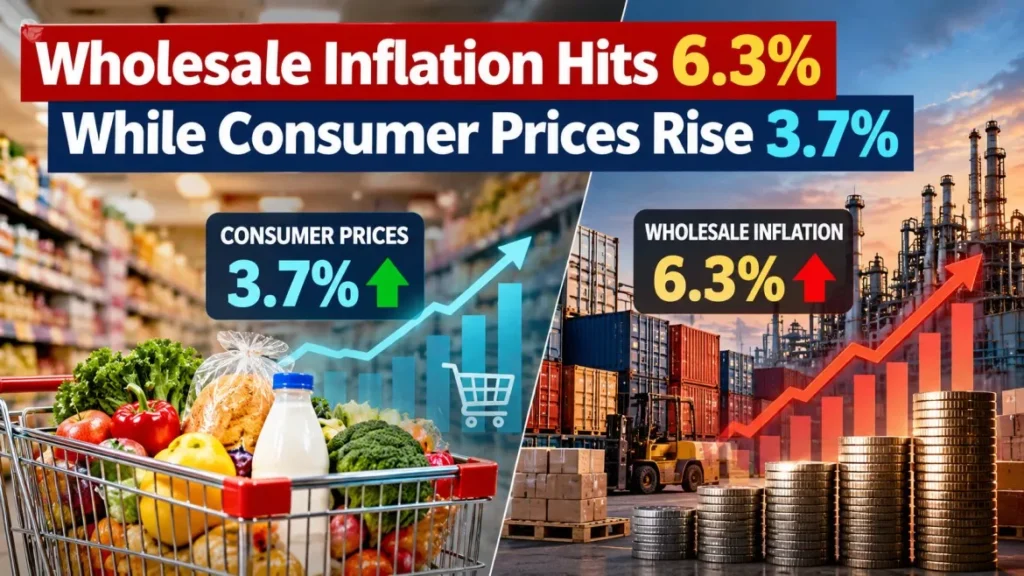

Wholesale inflation in the United States reached 6.3% in the year to September 2026, well above consumer inflation of 3.7%. The Producer Price Index rose 1.3% in the month, its largest advance since March 2022, on a 20.3% jump in gasoline. The Bureau of Labor Statistics published the figures on 15 October.
These are United States figures only. The Producer Price Index, or PPI, measures the prices American producers receive for their output — factory-gate and wholesale prices, not what shoppers pay at the till. As of 17 October 2026 it is the most recent reading; the next release covers October and is scheduled for 13 November 2026.
What the September Report Showed
The monthly increase was roughly double what forecasters expected. Economists had looked for a rise of about 0.6%, and the index came in at 1.3%, seasonally adjusted.
| Measure (September 2026) | Monthly change | 12-month change |
|---|---|---|
| Final demand (headline PPI) | +1.3% | +6.3% |
| Final demand goods | +2.6% | Not published in this form |
| Final demand services | +0.8% | Not published in this form |
| Final demand energy | +10.8% | Not published in this form |
| Core: excluding food, energy and trade services | +0.5% | +5.0% |
The release describes the monthly figure as the “largest advance since rising 1.7 percent in March 2022” and the annual figure as the “largest 12-month increase since moving up 6.4 percent in December 2022”. The goods increase of 2.6% was, in the agency’s words, “the largest increase since data were first calculated in December 2009”. The core measure accelerated from 0.3% in August to 0.5% in September.
Why Wholesale Inflation Is Running Above Consumer Inflation
The gap is the most informative part of this report, and it is wide on both the headline and the core measure. The consumer figures below come from the Consumer Price Index for September, published on 14 October 2026.
| 12-month change to September 2026 | Producer prices | Consumer prices | Gap |
|---|---|---|---|
| Headline | +6.3% | +3.7% | 2.6 points |
| Core | +5.0% | +2.6% | 2.4 points |
Two mechanical reasons account for much of it. The baskets differ: the PPI weights energy and freight heavily and excludes imports, while the CPI covers a consumer basket in which shelter is the largest single component. And the two indices measure different points in the supply chain, so a cost increase shows up in producer prices before it reaches a shelf, if it reaches one at all.
Research published by the Federal Reserve Bank of New York in October 2026 estimates that a 10% rise in import and producer prices lifts retail prices by about 5.6%, because distribution margins account for roughly half of what consumers pay for goods. The same research finds the indirect effect of domestic producer price rises more than doubles between six and twelve months.
Where the gap is not passed on, it lands on margins instead. Neither outcome is visible in this release: the PPI records what producers received, not how they divided the cost. The September consumer price report is the companion reading for that question.
What Drove the Increase
Energy did most of the work, and the report is specific about how much.
- Gasoline: up 20.3% at the producer level, which the agency says accounted for about half of the rise in final demand goods.
- Final demand energy: up 10.8%, which the release attributes as “over 80 percent” of the broad-based rise in final demand goods.
- Also higher: diesel fuel, jet fuel, crude petroleum, residential electric power, and fresh and dry vegetables.
- Chicken eggs: down 39.7%, the largest fall singled out in the release.
- Services: transportation and warehousing services rose 3.4%; trade services margins rose 1.4%, with machinery and vehicle wholesaling margins up 3.9%.
- Automotive fuels and lubricants retailing margins: down 30.3%, meaning fuel retailers’ own margins compressed sharply as wholesale costs rose.
On the consumer side the same force is visible but smaller: the CPI’s gasoline index rose 9.1% in September, “accounting for over half of the monthly all items increase”, and its energy index rose 5.2% in the month and 20.4% over twelve months. Readers following pump prices can compare the regional spread in US gas prices reported in late September.
What the Report Does Not Say
Three misreadings of a PPI release are common, and this one invites all three.
- The “over 80 percent” figure is narrower than it looks: it refers to energy’s share of the rise in final demand goods, not of the 1.3% headline increase. Services rose separately, by 0.8%.
- A 6.3% producer rate is not a 6.3% rise in anyone’s bills: the index tracks prices received by producers across the economy, and no household or business faces the average.
- The core reading is one of several: the 5.0% annual figure excludes food, energy and trade services. Other published core measures exclude different components and give different numbers, so figures quoted elsewhere may not be comparable.
What It Means for Interest Rates
The live question in the United States is whether the Federal Reserve raises rates again, not whether it cuts. The Federal Open Market Committee raised its target range by a quarter point to 3.75% to 4.00% on 16 September 2026, on a 12-0 vote, and most participants projected at least one further increase this year in the projections published with that decision.
The market reaction to the PPI was not what the size of the surprise implied. On the CME FedWatch measure, the probability of no change at the October meeting was 70.7% at 9:47 a.m. Eastern on 15 October 2026, with the chance of an increase below 30% — about four percentage points lower than the previous day. Those are single intraday readings of a market that reprices continuously, not forecasts.
Speaking on 13 October, before the PPI release, the president of the Federal Reserve Bank of New York, John Williams, said the Fed should raise rates once more this year and then hold, telling Bloomberg News: “I don’t think at this time I have any reason to believe that we would need to do more.”
The next decision is due on Wednesday 28 October 2026 at 2 p.m. Eastern, at the end of the committee’s 27-28 October meeting. The Federal Reserve’s own statement is the authoritative record of what it decides. For the earlier policy context, see the September rate decision and the officials’ projections.
The Dates That Come Next
- Wednesday 28 October 2026: the Federal Open Market Committee announces its rate decision at 2 p.m. Eastern.
- Tuesday 10 November 2026: the October Consumer Price Index is published at 8:30 a.m. Eastern.
- Friday 13 November 2026: the October Producer Price Index is published at 8:30 a.m. Eastern.
Frequently Asked Questions
What Is Wholesale Inflation?
It is the rate of change in the prices producers receive for their output, measured in the United States by the Producer Price Index. It covers factory-gate and wholesale prices rather than retail prices, so it is not the same as the inflation households experience.
How High Is US Wholesale Inflation Now?
The Producer Price Index for final demand rose 6.3% in the 12 months to September 2026 and 1.3% in the month, seasonally adjusted, according to the Bureau of Labor Statistics release of 15 October 2026. Excluding food, energy and trade services, the annual rate was 5.0%.
Why Is Wholesale Inflation Higher Than Consumer Inflation?
The two indices cover different baskets and different points in the supply chain. The PPI weights energy and freight heavily, while shelter is the largest component of the CPI. Cost increases also appear in producer prices before they reach retail prices, and part of the difference is absorbed in distribution margins.
What Caused the September 2026 Jump?
Energy. Final demand energy prices rose 10.8% and producer-level gasoline rose 20.3%, which the Bureau of Labor Statistics says accounted for about half of the rise in final demand goods. Diesel, jet fuel, crude petroleum and residential electric power also rose, while chicken eggs fell 39.7%.
Does This Mean the Federal Reserve Will Raise Rates?
That is not decided. The target range is 3.75% to 4.00%, set on 16 September 2026, and the next decision is due on 28 October 2026. On the CME FedWatch measure the chance of no change was 70.7% at 9:47 a.m. Eastern on 15 October, with an increase priced below 30%.
When Is the Next PPI Report?
The October 2026 Producer Price Index is scheduled for Friday 13 November 2026 at 8:30 a.m. Eastern. The October Consumer Price Index comes earlier, on Tuesday 10 November 2026.