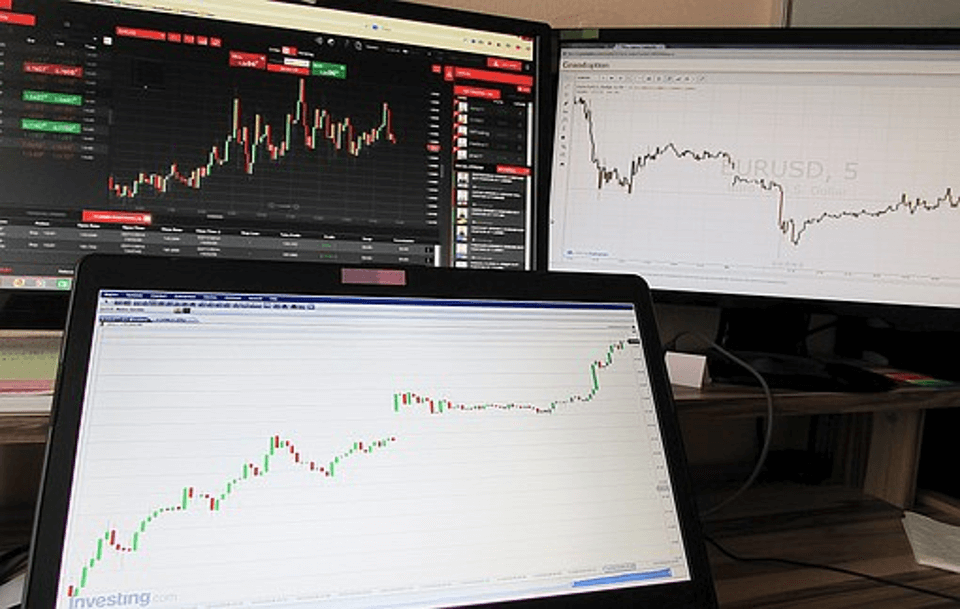
In the forex world, technical analysis refers to examining the activities and movements in the market to determine your next move. Traders invest lots of hours in understanding the market’s trends with the help of technical analysis to identify the opportunities. This involves an analysis of the strengths and weaknesses of the different securities to project the potential trajectory.
Though it’s still one of the reliable trade ways, technical analysis can be more effective if used alongside a technical tool. It makes the trader’s work a bit easier and enhances the probability of factual outcomes.
Technical Tool for Traders Success
One of the technical tools that is important for most traders is the OBV indicator. So what is an OBV indicator? OBV indicator is one of the technical tools that can help traders to attain success. OBV indicator is a cumulative technical tool that aggregates volume on up days and subtracts volume on down-days to gauge purchasing and selling pressure. All of the day’s turnover is deemed up-volume when the security closes higher than the prior close, which the vice versa is correct.
On Balance Volume was created by Joe Granville to track purchasing and selling pressure on a cumulative basis by subtracting volume on down days and adding volume on up days. Since then, the tool has become one of the first indicators for measuring positive and negative volume flow. Granville believed that volume was an essential factor in markets; thus, he created OBV to forecast when large market shifts would occur based on volume fluctuations.
OBV is predicated on a contrast amongst smart money — institutional investors – and less skilled ordinary investors. Even when the price stays stable, volume may arise when pension funds and mutual funds continue to buy into an asset that ordinary investors are selling. The price will eventually rise due to increased volume. Big start to sell, while smaller investors start to buy.
The actual specific quantitative value of OBV can be irrelevant, despite being shown on a price chart and quantified quantitatively. The indication is cumulative, but a designated starting point sets the time period; therefore, the real numerical value of OBV is arbitrarily based on the start date. Traders and analysts instead focus on the nature of OBV fluctuations over time, with the gradient of the OBV line carrying all of the analytical weight.
Interpreting How OBV Works
As a trader it is very important to get to know the tools that you are going to use in trading. Just like an IPhone 13 Pro user it is your responsibility to get to know the features of iPhone 13 Pro so that it will effectively and efficiently help you. So, below is the list of how OBV works in your trading as a trading tool.
- As you get to understand how OBV works, it’s also essential you concentrate on the direction of the OBV rather than its exact value.
- The increasing trend is expected to continue when price and OBV have higher peaks and troughs.
- The downward trend is expected to persist when price and OBV have lower peaks and troughs.
- If the OBV rises during a trading range, concentration could occur, signaling some upward breakout.
- An upwards trend is expected to halt or fail when the price continues to obtain a higher peak, but OBV fails to create higher peaks, also termed a negative divergence.
- The downwards trend is projected to stagnate or fail if the price keeps hitting lower bottoms, but OBV does not have a situation known as a positive divergence.
Conclusion
Like any other tool, OBV also has its setbacks. Being a leading indicator means it may make predictions but not much about what has transpired based on the signals it generates. It’s prone to producing erroneous signals as a result of this. As a result, trailing indicators might help to balance it. To watch for OBV line breakouts, add a moving average line to the OBV; you can confirm a price breakout if the OBV indicator produces a simultaneous breakout.
But because stock market participants repeat the same actions, OBV holds an essential space and remains highly reliable. However, there can never be a 100 percent chance that any pattern or signal would provide the same results. To have any chance of long-term success as a technical trader, you must meticulously collect data from your trades and use expectancy rules. Your win-loss ratio, and other indicators of the expectation formula, must be kept track of.


