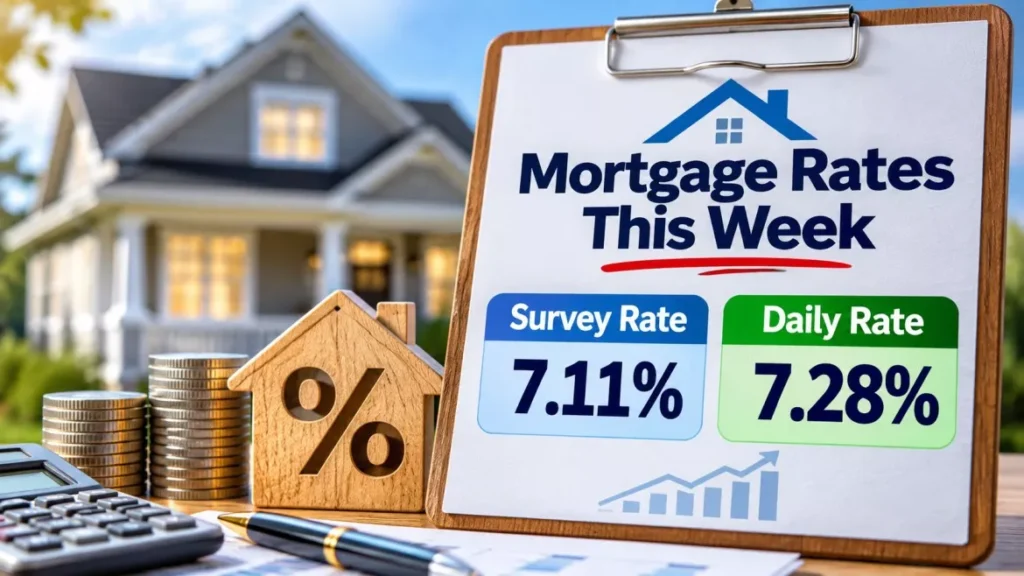

Freddie Mac’s weekly survey put the average United States 30-year fixed mortgage rate at 7.11% on 12 November 2026, a fourth consecutive weekly fall and the lowest reading in seven weeks. Daily lender trackers have since quoted 7.19% to 7.32%. Mortgage rates this week therefore read differently depending on which measure is cited.
What Freddie Mac Reported on 12 November
The 30-year fixed average fell seven basis points to 7.11%, from 7.18% a week earlier. A basis point is one hundredth of a percentage point.
Sam Khater, Freddie Mac’s chief economist, said mortgage rates “dropped to their lowest level in seven weeks”. The readings come from Freddie Mac’s Primary Mortgage Market Survey, published each Thursday at noon Eastern time.
| Loan type | 12 November 2026 | Week earlier | Year earlier |
|---|---|---|---|
| 30-year fixed | 7.11% | 7.18% | 6.24% |
| 15-year fixed | 6.45% | 6.57% | 5.49% |
Both averages remain above where they stood a year earlier. The 30-year figure sits 87 basis points above the 6.24% recorded in the comparable week of 2025, so a run of weekly falls has not returned borrowing costs to last year’s level.
The sequence of declines began with a 7.32% reading in late October, which Freddie Mac described at the time as the first fall in nine weeks. The Associated Press reported that the 30-year average had peaked at about 7.4% in early October.
Why Mortgage Rates This Week Differ by Source
No single published number is the rate, because the main publishers measure different things over different periods.
As of Saturday 14 November 2026, the most recent weekly benchmark for the United States is Freddie Mac’s 7.11%, published on 12 November, while the most recent daily readings run from 7.19% to 7.32%.
| Source | Figure | As of | What it measures |
|---|---|---|---|
| Freddie Mac | 7.11% | 12 November 2026 | Weekly average of lender quotes, conventional conforming loans |
| Money | 7.19% | 13 November 2026 | Daily average interest rate, 30-year fixed |
| Mortgage Bankers Association | 7.21% | Week to 6 November 2026 | Average contract rate on actual applications |
| Bankrate | 7.28% | 14 November 2026 | Daily national average, 30-year fixed |
| NerdWallet | 7.32% | 14 November 2026 | Daily national average, quoted as an APR |
Two differences explain most of the spread. A weekly survey average describes the week that has already passed, so it lags a market that reprices daily. An annual percentage rate, or APR, folds lender fees into the figure, so it prints higher than a quoted interest rate on the same loan.
The direction matters as much as the level. Money’s rate data showed the 30-year average rising 0.15 percentage points on Thursday 12 November, and Bankrate recorded 7.28% on the morning of Saturday 14 November, eight basis points above a week earlier. Both moved up in the days Freddie Mac’s survey recorded as a fall.
The Bond Market Moved the Other Way
Fixed mortgage rates in the United States track long-dated government bond yields more closely than they track the central bank’s policy rate.
Those yields rose through the survey week, according to the United States Treasury’s daily par yield curve. No reading was published for 11 November, the Veterans Day federal holiday.
| Date (2026) | 10-year Treasury | 30-year Treasury |
|---|---|---|
| 6 November | 4.86% | 5.26% |
| 9 November | 4.88% | 5.26% |
| 10 November | 4.98% | 5.35% |
| 12 November | 5.10% | 5.43% |
| 13 November | 5.15% | 5.47% |
The 10-year yield gained 29 basis points between 6 and 13 November. Because Freddie Mac’s average is assembled from quotes gathered across the survey week, the 7.11% reading largely reflects pricing set before that move rather than after it.
That is the mechanism behind the apparent contradiction. The weekly benchmark fell and the bond market rose in the same seven days, and the two series describe different moments rather than disagreeing about one.
Why the Fed’s December Meeting Is a Separate Question
A change in the policy rate would not move the 30-year fixed rate directly. The Federal Open Market Committee, the panel of the United States central bank that sets its policy interest rate, held its target range at 3.75% to 4% on 28 October 2026. The vote was 10 to 2, with Lisa D. Cook and Beth M. Hammack dissenting in favour of a quarter-point increase.
The committee’s next scheduled decision falls on 8 and 9 December 2026. Market-implied odds of a quarter-point increase there have risen and are quoted inconsistently across outlets: readings drawn from CME Group’s FedWatch tool were reported at about 77% on 3 November, 88.8% on 10 November after the October inflation release, and 93% on 12 November. These are prices in interest-rate futures rather than forecasts, and they move daily.
The policy rate anchors short-term borrowing. The 30-year fixed rate follows the 10-year yield, which already embeds what investors expect the committee to do, so an increase that markets have priced need not lift mortgage rates on the day it happens. Readus247 covered the producer price data behind those December expectations separately.
What a National Average Does Not Show
Every figure above is a national average for the United States, not a quote available to an individual borrower.
Freddie Mac’s survey covers conventional conforming loans, meaning loans within the size limit eligible for purchase by Fannie Mae and Freddie Mac, for borrowers with strong credit and a substantial deposit. An individual rate varies with credit score, deposit size, loan amount, property type, state and lender. Government-backed FHA and VA loans, and jumbo loans above the conforming limit, are priced on separate schedules again.
Dates Already Set
- Wednesday 18 November 2026: The Mortgage Bankers Association publishes its weekly applications survey, covering the week to 13 November.
- Thursday 19 November 2026: Freddie Mac publishes its next Primary Mortgage Market Survey, the first weekly reading able to capture the rise in yields.
- Late November 2026: The Federal Housing Finance Agency, the United States regulator of Fannie Mae and Freddie Mac, is expected to publish the third-quarter house price data that sets the 2027 conforming loan limit.
- Tuesday 8 and Wednesday 9 December 2026: The Federal Open Market Committee meets and publishes a Summary of Economic Projections.
- Tuesday 26 and Wednesday 27 January 2027: The committee’s first scheduled meeting of 2027, a date the Federal Reserve lists as tentative.
The 2027 conforming loan limit has not been announced. The 2026 baseline is $832,750 for a one-unit property in most of the country, set on 25 November 2025, with a ceiling of $1,249,125 in designated high-cost areas. Estimates of $845,000 to $850,000 circulating from individual lenders carry no federal standing until the agency publishes its figure.
Frequently Asked Questions
What Is the Current 30-Year Mortgage Rate in the United States?
Freddie Mac’s weekly survey average was 7.11% on 12 November 2026. Daily trackers published on 13 and 14 November ranged from 7.19% to 7.32%, the higher figures being annual percentage rates that include fees.
Why Do Mortgage Rates This Week Differ Between Websites?
Because the figures measure different things. Freddie Mac reports a weekly average of lender quotes for the week just ended, daily trackers report the current day, and an APR adds lender fees to the interest rate.
Did the Bond Market Confirm the Fall in Mortgage Rates?
No. The 10-year Treasury yield rose from 4.86% on 6 November 2026 to 5.15% on 13 November, according to United States Treasury data, while the weekly mortgage survey recorded a fall over broadly the same period.
When Is the Next Freddie Mac Mortgage Rate Release?
Thursday 19 November 2026, at noon Eastern time. It is the first weekly reading that can reflect the rise in Treasury yields recorded on 12 and 13 November.
What Is the Conforming Loan Limit for 2027?
It has not been published. The 2026 baseline limit is $832,750 in most of the United States, and the Federal Housing Finance Agency is expected to announce the 2027 figure in late November 2026.