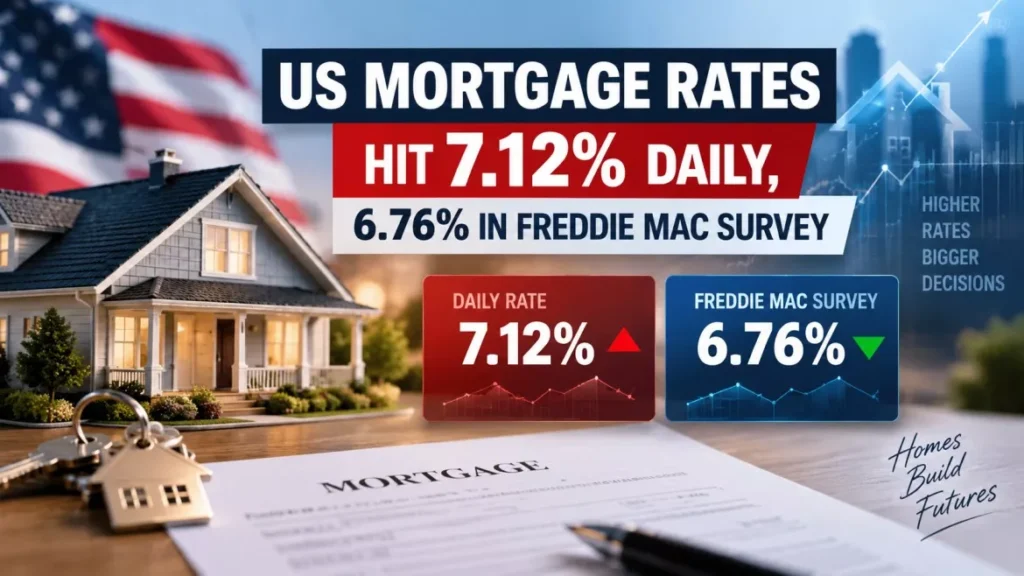

The average 30-year fixed mortgage rate in the United States crossed 7% on 10 September 2026, the first time since May 2025. Mortgage News Daily’s index reached 7.07% that day and 7.12% on 11 September. Freddie Mac’s weekly survey, published the same Thursday, read 6.76%.
Where US Mortgage Rates Stand Right Now
As of 11 September 2026, the highest published daily reading for a 30-year fixed mortgage in the United States is 7.12%, while the most recent weekly survey reading is 6.76%. Both are current. They are not measuring the same thing.
Mortgage News Daily, a US mortgage-market data service that publishes a lender-rate index each weekday afternoon, put the 30-year fixed at 6.97% on 9 September, 7.07% on 10 September and 7.12% on 11 September. It described the 10 September reading as the highest since 21 May 2025.
Freddie Mac, the US government-sponsored enterprise that buys mortgages from lenders, put the 30-year fixed at 6.76% for the week ending 10 September 2026 in its Primary Mortgage Market Survey, up from 6.71% a week earlier and 6.35% a year earlier. Its 15-year average was 6.09%, against 6.04% a week earlier and 5.50% a year earlier.
| Source | 30-Year Fixed | Reading Date | What It Measures |
|---|---|---|---|
| Mortgage News Daily index | 7.12% | 11 September 2026 | Same-day lender pricing, adjusted for discount points |
| Freddie Mac Primary Mortgage Market Survey | 6.76% | Week ending 10 September 2026 | Loan applications from the prior Thursday to Wednesday, excluding points and fees |
| Mortgage Bankers Association weekly survey | 6.85% | Week ending 4 September 2026 | Average contract rate on applications at member lenders |
| Zillow, as cited by Yahoo Finance | 6.64% | 10 September 2026 | Lender-quoted rates on its own marketplace |
Mortgage News Daily’s other averages on 11 September 2026 were 6.65% for a 15-year fixed, 6.68% for a 30-year loan insured by the Federal Housing Administration, 7.25% for a 30-year jumbo loan above the conforming limit, and 6.67% for a 7/6 adjustable-rate mortgage tied to the Secured Overnight Financing Rate. Each rose between three and six hundredths of a percentage point on the day.
Why Two Official Rates Differ by 36 Basis Points
The 36-basis-point gap between 7.12% and 6.76% is caused by two things: a timing lag and a points adjustment. A basis point is one hundredth of a percentage point, so 36 basis points is 0.36 of a percentage point.
Freddie Mac rebuilt the Primary Mortgage Market Survey in 2022. It no longer telephones lenders. Instead, in Freddie Mac’s own description of the method, it will “create weekly application measures by aggregating applications from Thursday prior to the current week through Wednesday”. A survey released at noon Eastern time on Thursday 10 September therefore describes the week that ended on Wednesday 9 September, before the move through 7% happened.
The second difference is discount points, the upfront fee a borrower can pay to buy down a rate. Freddie Mac states plainly that because its underwriting system “does not capture discount points or origination fees, we are not able to report them in the PMMS going forward”. A 6.75% rate bought down with one point costs roughly the same as 7.00% with no points, so a survey that ignores points reads lower than an index that prices them in. Mortgage News Daily’s index adjusts for points so that one day can be compared with the next.
Neither number is wrong. A weekly survey that excludes fees and looks backwards will sit below a daily index that includes fees and looks at today, and the gap widens fastest in exactly the weeks when rates are moving quickly.
Why None of These Averages Is an Individual Borrower’s Rate
Every figure above is a national average for the United States, and no individual loan is priced off it. Quoted rates vary with credit score, loan size, down payment or equity, property type, occupancy, whether points are paid, and the state the property sits in.
The averages also describe one product each. A borrower comparing a 30-year fixed conforming loan against the 7.25% jumbo average or the 6.68% FHA average is comparing different underwriting, different limits and different insurance costs. None of these rates applies outside the United States; other countries price mortgages off their own benchmarks and lending rules.
What Pushed Rates Through 7% This Week
Mortgage rates in the United States track the 10-year Treasury yield rather than the Federal Reserve’s policy rate, and that yield jumped this week. The 10-year constant maturity yield rose from 4.83% on 9 September to 4.95% on 10 September, according to the Federal Reserve’s H.15 release dated 11 September 2026. It stood at 4.78% as recently as 4 September.
Two inflation signals landed in the same week. US producer prices rose 0.4% in August 2026, in line with forecasts but well above July’s 0.1% gain. Brent crude also moved above $100 a barrel for the first time since May, on fighting between the United States and Iran, which feeds directly into expectations for future inflation.
Joel Kan, vice-president and deputy chief economist at the Mortgage Bankers Association, attributed the earlier part of the move to the bond market rather than to housing, saying rates “moved higher last week, driven by ongoing investor concerns over inflation and the federal budget deficit”.
What the Loan-Application Data Shows
Borrowing demand was already falling before rates crossed 7%. In the Mortgage Bankers Association’s weekly applications survey for the week ending 4 September 2026, released on 9 September, total application volume fell 2.7% on a seasonally adjusted basis from the week before.
- Refinance index: Down 6% on the week and 25% below the same week of 2025, the slowest weekly pace since May 2025.
- Purchase index: Down 0.2% seasonally adjusted on the week, but still 4% higher than a year earlier on an unadjusted basis.
- Refinance share: 40.9% of all applications, down from 41.8% the previous week.
- Average contract rate: 6.85% for a 30-year fixed conforming loan, up from 6.79%, the highest in that survey since June 2025.
That survey window closed six days before the daily index reached 7.12%, so it does not yet capture the reaction to rates above 7%. The site’s earlier snapshot of US mortgage rates ranging from 6.49% to 6.91% on 8 September shows how far the market has moved in three business days.
What Is Scheduled Next
Three dated events will update this picture, and none of the outcomes is known.
- Tuesday 15 and Wednesday 16 September 2026: The Federal Open Market Committee meets, with its statement due at 2pm US Eastern time on 16 September. The federal funds target range has been 3.50% to 3.75% since December 2025. The committee sets that overnight rate, not mortgage rates.
- Wednesday 16 September 2026: The Mortgage Bankers Association publishes its applications survey for the week ending 11 September, the first to cover days on which the daily index was above 7%.
- Thursday 17 September 2026: Freddie Mac publishes the next Primary Mortgage Market Survey at noon Eastern time. Its window runs from 10 to 16 September, so it is the first weekly survey that will include the crossing.
Market pricing ahead of the meeting has leaned towards a rate increase rather than a cut, a shift covered in this site’s report on how the August CPI report lifted Fed hike odds. What the committee will actually do, and how the bond market will react, is not settled.
Frequently Asked Questions
What Is the Current 30-Year Mortgage Rate in the United States?
It depends on the measure. Mortgage News Daily’s daily index read 7.12% on 11 September 2026. Freddie Mac’s weekly survey read 6.76% for the week ending 10 September 2026.
Why Does Freddie Mac Show a Lower Rate Than Daily Trackers?
Freddie Mac’s survey aggregates loan applications from the prior Thursday through Wednesday, so it lags by several days, and it excludes discount points and origination fees. Daily indexes price in points and report the same day.
When Did US Mortgage Rates Last Exceed 7%?
Mortgage News Daily described its 7.07% reading on 10 September 2026 as the highest since 21 May 2025.
What Pushed US Mortgage Rates Above 7% in September 2026?
A bond-market selloff. The 10-year Treasury constant maturity yield rose to 4.95% on 10 September 2026 from 4.83% the day before, after US producer prices rose 0.4% in August and Brent crude moved above $100 a barrel.
Do These US Mortgage Rates Apply in Other Countries?
No. Every figure here is a United States national average for US loan products. Mortgage pricing in other markets follows different benchmarks, lending rules and product structures.