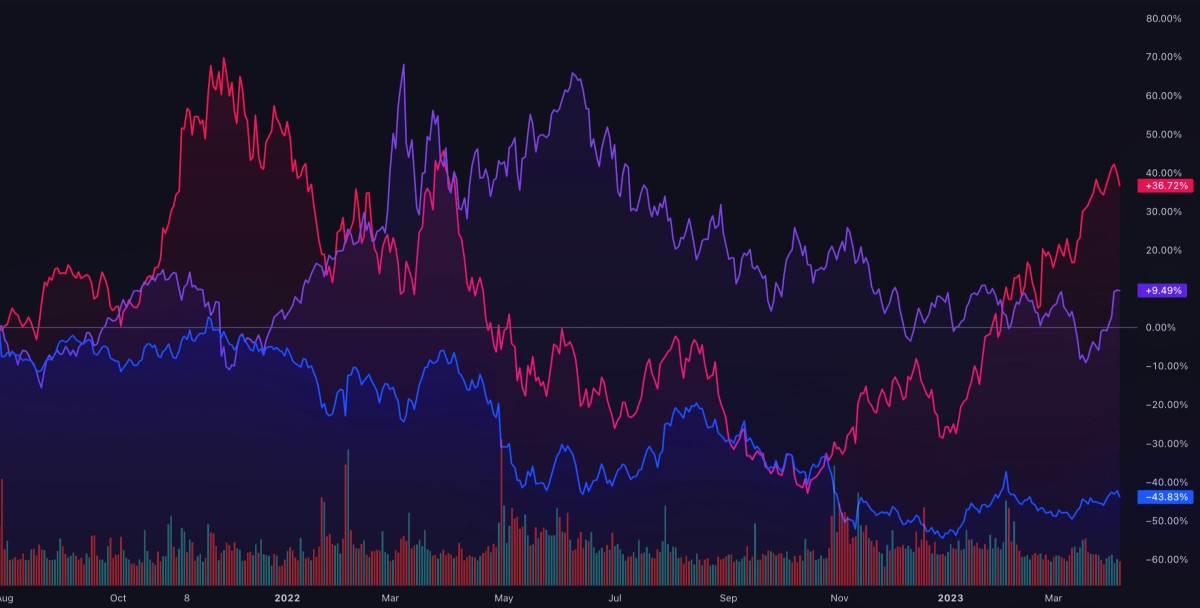
TradingView charts are graphical representations of financial market data used to analyze price movements and market trends. They display data using candlestick or line charts, representing open, high, low, and close prices for each time interval.
Users can overlay technical indicators like moving averages or relative strength index (RSI) for deeper insights.
These charts aid in identifying trends, momentum, and potential price movements, helping traders make informed decisions. Understanding these charts is a crucial skill for traders.
Getting Started with TradingView
To begin with, you’ll need to access TradingView’s website or app and search for the FinNifty chart. Here are some tips to make the most out of your TradingView chart live experience:
1. Utilize Technical Indicators
Apply technical indicators like Moving Averages, RSI, and MACD to your chart to analyze market trends and predict future movements.
2. Chart Patterns Recognition
Familiarize yourself with chart patterns such as triangles, head and shoulders, and flags. TradingView provides tools to draw these patterns on the chart, helping you spot potential breakout or breakdown points.
3. Volume Analysis
Pay attention to trading volumes, as they can provide clues about the strength of a price move. Higher volumes in a trending direction often confirm the trend’s reliability.
4. Customizable Time Frames
Depending on your trading strategy, you can view the chart in various time frames, from one minute to one month. This flexibility allows for both short-term and long-term analysis.
Strategies for Trading FinNifty Using TradingView Charts
TradingView is a powerful platform for analyzing financial markets, and it offers several features to help traders maximize their analysis and improve trading strategies for the Nifty Financial Services Index (commonly known as Finnifty).
Let’s dive into how you can effectively use TradingView for Finnifty analysis:
- Trend Following: By identifying the overall trend using indicators like the Moving Average, you can align your trades with the market’s direction, increasing your chances of success.
- Support and Resistance Trading: Use TradingView’s drawing tools to mark key support and resistance levels. You may use these levels as a way in or out.
- Breakout Trading: Keep an eye out for patterns indicating a consolidation phase. A breakout from this phase of high volume can signal a new trend, providing a trading opportunity.
While TradingView charts provide a wealth of information, successful trading requires discipline and a well-thought-out strategy. It’s crucial to set stop-loss orders to manage risk and avoid emotional decision-making.
Additionally, continually educating yourself on market analysis techniques and staying updated with financial news will enhance your trading skills.
Conclusion
TradingView charts are a great tool for understanding how FinNifty is doing in the market. It gives you live charts and various technical indicators to help you analyze and make smart trading decisions. It’s a useful resource for traders looking to navigate the complexities of the financial markets. To use this platform without any additional cost, open an account with Dhan. Dhan offers its users free integration with TradingView


